Have you ever wondered which hospitals in the Health Roundtable (HRT) membership you should compare to your hospital? In INSIGHTS there has always been functionality available to compare the focus hospital against a peer group of ten hospitals, defined by the HRT and based on hospitals that are statistically similar in terms of caseload and clinical complexity. However, our members often find that these are not appropriate when displaying results for specific patient cohorts or clinical departments, in your hospital.
To enable users to utilise alternative peer groups, functionality is being introduced which can be used to create a peer group based on the Australian Institute of Health and Welfare (AIHW) national peer groups; a product of research into the nature of hospital services provided in Australia; which we've also mapped to New Zealand hospitals for the benefit of the whole HRT membership. We endorse choosing the AIHW national peer groups as it allows the focus hospital to quickly benchmark their results against a broader list of “like for like” hospitals; backed by a robust methodology of categorisation of hospitals.
Expand the “1. Select a peer group(s)” dropdown to now view options to select alternative peer groups to your “HRT Defined Peers”:
 Click here
 to learn more about the national peer group categories.
Users are often interested in looking at their results for the last 12 months of data available. When you start your investigation in the dashboard view the default time period visible is the last four years of data. However, there is a range of dropdowns that can be used to select a more recent time period. To quickly select a bespoke range of discharge months, select the month corresponding to the start of the desired period; then while holding the Shift Key also select the month corresponding to the end of the desired period.
Hospitals who are subscribed to Package C have their latest data; available to November 2018.
In August 2018, our Chief Data Scientist Rohan Cattell reported in an article that our Health Roundtable members were having focussed discussions with us about Hospital Acquired Complications (HACs) and shared his thoughts on how to frame the discussion such that health service staff are engaged in reducing HACs. He also presented a scenario whereby your health service is showing in reports as having a higher occurrence of hospital-acquired infections, in comparison to the average HRT hospital. Rohan stated in his article “it’s very easy to come up with a lot of untested hypotheses as to why this comparison might be inaccurate.” and proceeded in giving guidance on how INSIGHTS could be used to objectively drilldown to cases that are generally agreed as clinically avoidable.
Following on from that article, I have reported through these newsletters new features that enable users to view your results in context,
create online communities who can seamlessly share their findings across a multi-disciplinary group and work in collaboration to turn data into actionable insights. From February, you can use the functionality on peer group selection to create peer groups based on a nationally
recognised methodology.
We recently tested hypotheses on behalf of an HRT member that a specific department in their principal referring hospital has a statistically higher rate of urinary tract infections when compared to similar departments in other HRT members facilities. Here is how we approached testing this hypothesis:
1 - Using your Major Complication Group and Major Complication dropdowns, filter your HACs results to the rate of urinary tract infections.
2 - Using your peer group dropdowns, expand your peer group to all principal referrer hospitals, to determine how the focus hospital’s results fair from a national perspective.
3 - Select the Radiation Oncology department
4 - Review time series chart and choose a time period where occurrences have increased.
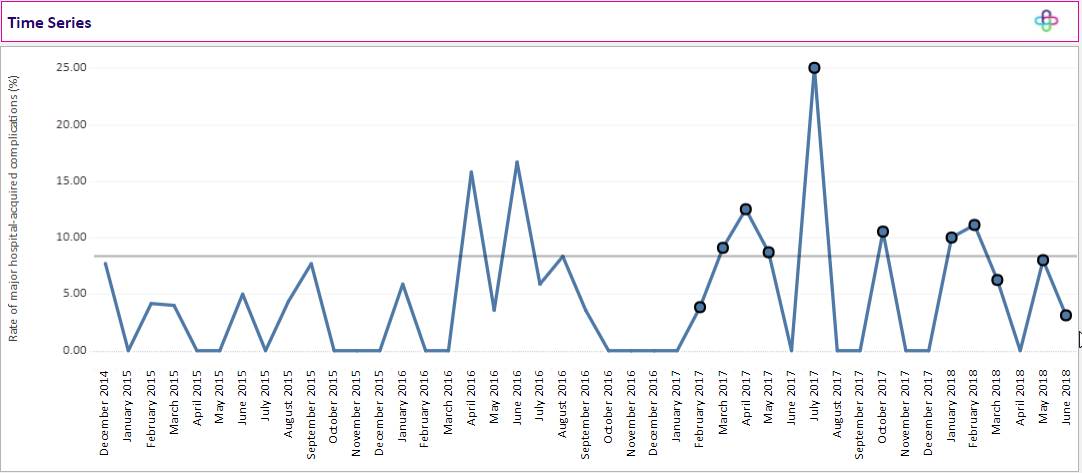
5 - Select the number of complication episodes to get all recent cases of urinary tract infections for clinical review
The analysis showed that the specific department has a relatively high rate of urinary tract infections when compared to a broad list of principal referrer hospitals. The time series identified that an increase in the frequency of cases in the calendar year 2017. Often, a clinical review of the individual cases can establish whether they were clinically avoidable and if so, support a case for change in the management of their department's infection control processes. Through collaboration with colleagues and external partners, our members can identify ways of managing infection differently by implementing innovations stored in our innovations library.
Health Roundtable Innovation Library:
http://library.healthroundtable.org/Documents/Browse
Hospital Acquired Complications Article:
https://www.healthroundtable.org/GetNews/NewsArticle/tabid/1457/itemid/377/amid/5205/default.aspx